Using Elastic APM to visualize asyncio behavior
A few weeks ago, Chris Wellons’ blog “Latency in Asynchronous Python” was shared on our internal #python channel at Elastic, and as someone looking into the performance characteristics of a recent asyncio-related change, I gave it a read and you should too. It was a timely post as it made me think ahead about a few things, and coincided nicely with our recent usage of Elastic’s Application Performance Monitoring solution.
“It’s not what you know, it’s what you can prove.”
—Detective Alonzo Harris in the movie Training Day
Background
I work on the billing team for the Elastic Cloud, where we process usage data and charge customers accordingly. One of the ways we charge is via integrations with the AWS and GCP marketplaces—with Azure on the way—giving customers the ability to draw from committed spend on those platforms and consolidate their infrastructure spending under one account. It’s a feature a lot of customers want, but it introduces some complexity compared to how we bill our direct payment customers.
While most of our billing is done in arrears—at the end of the month—marketplaces require that charges are reported to them as they occur. As such, we have a system that reports marketplace customer usage every hour.
The initial version of this service, while built using Python’s async/await syntax, didn’t leverage a lot of the concurrency opportunities the asyncio library provides…”premature optimization” and all0. It was designed to be able to take advantage of them, but worked initially as a generator pipeline. It was a greenfield project starting with no customers, so building something that worked correctly was more important than its speed. It is billing software, after all.
async def report_usage(bills):
    async for bill in bills:
        await submit_bill(bill)

async def main():
    users = get_users_to_bill()
    clusters = get_clusters_used(users)
    bills = generate_bills(clusters)
    await report_usage(bills)
This is basically what our pipeline looked like, where its coroutines all the way down. Because none of those first coroutines were awaited they don’t initially do anything. That is, until we hit Line 9. Once that is awaited, Line 2 is what starts pulling everything through, so this finds one user with usage, gets their cluster details, computes their bill, submits it, then keeps iterating through all of the users with new usage. With a small userbase this runs “fast enough”, but we’re doing a lot of stuff sequentially that we don’t need to. Submitting one user’s bill shouldn’t block us from finding another user’s clusters which shouldn’t block us from generating a third user’s bills, all of which involve platform-specific REST APIs, Postgres queries, Elasticsearch searches, and more. It’s a very I/O heavy application.
The following sentence of Knuth’s “premature optimization” quote0—”Yet we should not pass up our opportunities in that critical 3%.”—recently become more relevant, or critical. This system is not only processing more marketplace users than before, it’s processing multiple platforms of users instead of only GCP. Maybe it’s time to dig deeper into asyncio and optimize.
Let’s Get Concurrent
Once we have all of the users, a first cut would be to process them concurrently and get an immediate boost. There’s a lot of users now so we need to restrict how concurrent we can be so we’re not overloading anything, especially not the cloud platforms we’re reporting to.
async def process_user(user, semaphore):
    async with semaphore:
        clusters = await get_clusters_used(user)
        bill = await generate_bill(clusters)
        await report_usage(bill)

async def main():
    tasks = []
    sem = asyncio.Semaphore(MAX_CONCURRENCY)

    async for user in get_users_to_bill():
        tasks.append(asyncio.create_task(process_user(user, sem)))

    await asyncio.gather(*tasks)
That works fairly well! It runs many times faster than our old pipeline if you
look at wall clock time, but if we have 1,000 users and MAX_CONCURRENCY=50,
this starts 1,000 tasks and we allow 50 of them to do work at a time. The final
task to run might do 1 second of real work but it waited many seconds for
the opportunity.
A quick aside: Chris’ post is mostly about how this situation affects background tasks when a big group of new tasks like our
process_usertasks start up. That problem doesn’t really apply to this system as it’s a standalone application initiated bycronand processes users then exits. There aren’t any other background tasks to interrupt…yet.
Bringing APM Into It
We already had logs and metrics flowing into Elasticsearch, but those only tell part of the story. Elastic’s observability solutions include a pretty cool APM product, and we love to use our own products, so we started using the elastic-apm package to send performance data to APM Server.
import elasticapm
client = elasticapm.Client()  # get config from env

async def process_user(user, semaphore, parent_tx):
    client.begin_transaction(
        "user", trace_parent=parent_tx.trace_parent
    )
    elasticapm.set_user_context(user_id=user.user_id)

    async with semaphore:
        ...
        client.end_transaction("user task")
This creates a "user task" transaction for each user that we’re going to
process, and inside of it we have several spans for some internal functions
that do some of the work, like gathering different types of usage via
searches and reporting usage to platform-specific REST APIs.
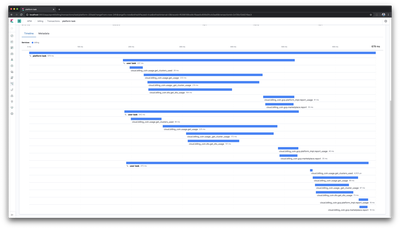
If we look at what a run of the service shows in the APM timeline
with MAX_CONCURRENCY=2 and then process three users, we see the following:

Here we have three "user task" transactions stacked on top of each other,
all started at the same time, but with only the top two making progress.
The third task begins doing actual work after one of those first two ended.
Given the way the code was written we expect that, and without APM we might even think this is fine. Frankly, given how the system needs to work today, it is sort of fine. That is until we need to look at how long user tasks are running for and realize our metrics and understanding are way off.
If we’re running for three users or three thousand users, each individual user should take around the same amount of time to run, but the way we wrote this just about every metric will be useless. Even in our tiny example above, the third task clearly completed its actual work the fastest but it gets penalized by having done nothing for for about two-thirds of its lifetime.
Refactoring
Chris’ post mentions using an asyncio.Queue for the concurrent tasks
we want to run. Before I mentioned that our service doesn’t need to worry
about anything but those "user task" instances, so if we could live
with useless metrics we’d be ok [narrator’s voice: they can’t], but we
do have plans that will need to solve what Chris is solving.
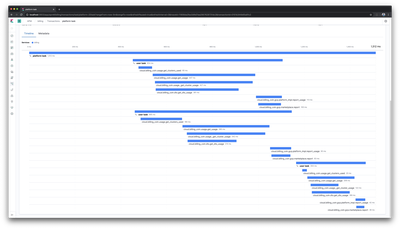
After implementing roughly what he did, we end up with a much more useful timeline1.

We see the same three stacked transactions with the first two beginning right away, and now we see the third doesn’t begin until one of the first two ends. Perfect! Now the third or three thousandth task will take only as long as it actually takes that task to run.
Not only are our metrics more useful in the short term, we’re now ready for those changes I mentioned where we need to give background tasks a fair chance. If we’re 200 requests into those 3,000 and a new task needs to run, it gets a chance as the 201st instead of as the 3,001st.
Using APM lets us visualize impact our changes have and gives us the ability to track that all over time. It’s a pretty great tool and we’re excited to use it even more.
Conclusion
asynciois pretty powerful, but it can be a bit difficult to understand and it’s not the right solution for every problem. If you’re interested in learning more about it, Łukasz Langa, a core CPython developer who works on EdgeDB—a database built on top of Postgres via the excellent asyncpg library (which we use a lot!)—has created a video series all about how asyncio does what it does. I highly recommend it.APM—Elastic’s or otherwise—is a really valuable tool. I thought I knew how some of our stuff was working, but proving it via APM has helped inform a bunch of decisions already in the short time this service has been using it.
- 0(1,2)
-
“We should forget about small efficiencies, say about 97% of the time: premature optimization is the root of all evil.” — Donald Knuth, “Structured Programming With Go To Statements”
- 1
-
Don’t pay attention to the exact timing differences between the two implementations. These timelines are generated from an integration test on my laptop that is varying levels of overheating.